What We're Building
In this tutorial, we explore a sophisticated financial analysis system that provides hedge fund-level investment research through automated AI agents. This project demonstrates how to build complex, multi-agent workflows with parallel processing using Motia.
The system works like a real hedge fund research team: When you submit a stock query, the workflow automatically gathers web intelligence and real-time market data, then dispatches this information to five specialized AI analysts working simultaneously. A fundamental analyst evaluates company financials and intrinsic value, while a portfolio manager assesses allocation strategies. Simultaneously, a risk manager identifies potential threats and a technical analyst examines chart patterns. A general market analyst provides overall context. Finally, all perspectives are synthesised into a comprehensive investment report, delivering institutional-quality analysis in under a minute.
The workflow orchestrates this through Motia's event-driven architecture, where each step triggers the next automatically based on data availability. Web search and financial data retrieval happen in parallel, their results are coordinated and fed to an initial AI analysis, which then triggers four specialized analysts to run concurrently. Once all analyses complete, they're aggregated into a unified report accessible via API or UI.
This project showcases Motia's ability to orchestrate complex workflows with parallel execution. Multiple AI analysts run simultaneously, each receiving the same data but providing specialized perspectives—mimicking how real hedge funds operate with teams of specialized analysts.
Prerequisites
Before getting into this project, you will need the following:
- Node.js 18+ installed on your system
- API Keys for external services:
- Nebius AI API key - Get your key from Nebius Studio
- Alpha Vantage API key - Get from Alpha Vantage
- Serper API key - Get from Serper.dev
- Basic familiarity with:
- TypeScript/JavaScript
- REST APIs
- Event-driven architecture concepts
- Financial terminology (P/E ratio, market cap, etc.)
Getting Started
Clone the Repository
Clone the AI Hedge Fund example from the Motia examples repository:
git clone <https://github.com/MotiaDev/motia-examples.git>
cd motia-examples/examples/ai-hedgefund
Install Dependencies
Install the required packages:
npm install
This installs Motia, TypeScript dependencies, and all external service integrations (axios, yahoo-finance2, alpha-vantage-cli, openai SDK).
Configure Environment Variables
Create a .env file in the project root:
*# Nebius AI (required for all analyses)*
NEBIUS_API_KEY=your_nebius_api_key_here
NEBIUS_BASE_URL=https://api.studio.nebius.com/v1/
NEBIUS_MODEL=Qwen/Qwen3-14B

*# Alpha Vantage (for financial data)*
ALPHA_VINTAGE_KEY=your_alpha_vantage_api_key_here

*# Serper (for web search)*
SERPER_API_KEY=your_serper_api_key_here
Getting your API keys:
- Nebius AI: Sign up at studio.nebius.com, navigate to API keys, and create a new key
- Alpha Vantage: Visit alphavantage.co/support/#api-key and claim your free key
- Serper: Register at serper.dev, get 2,500 free searches per month
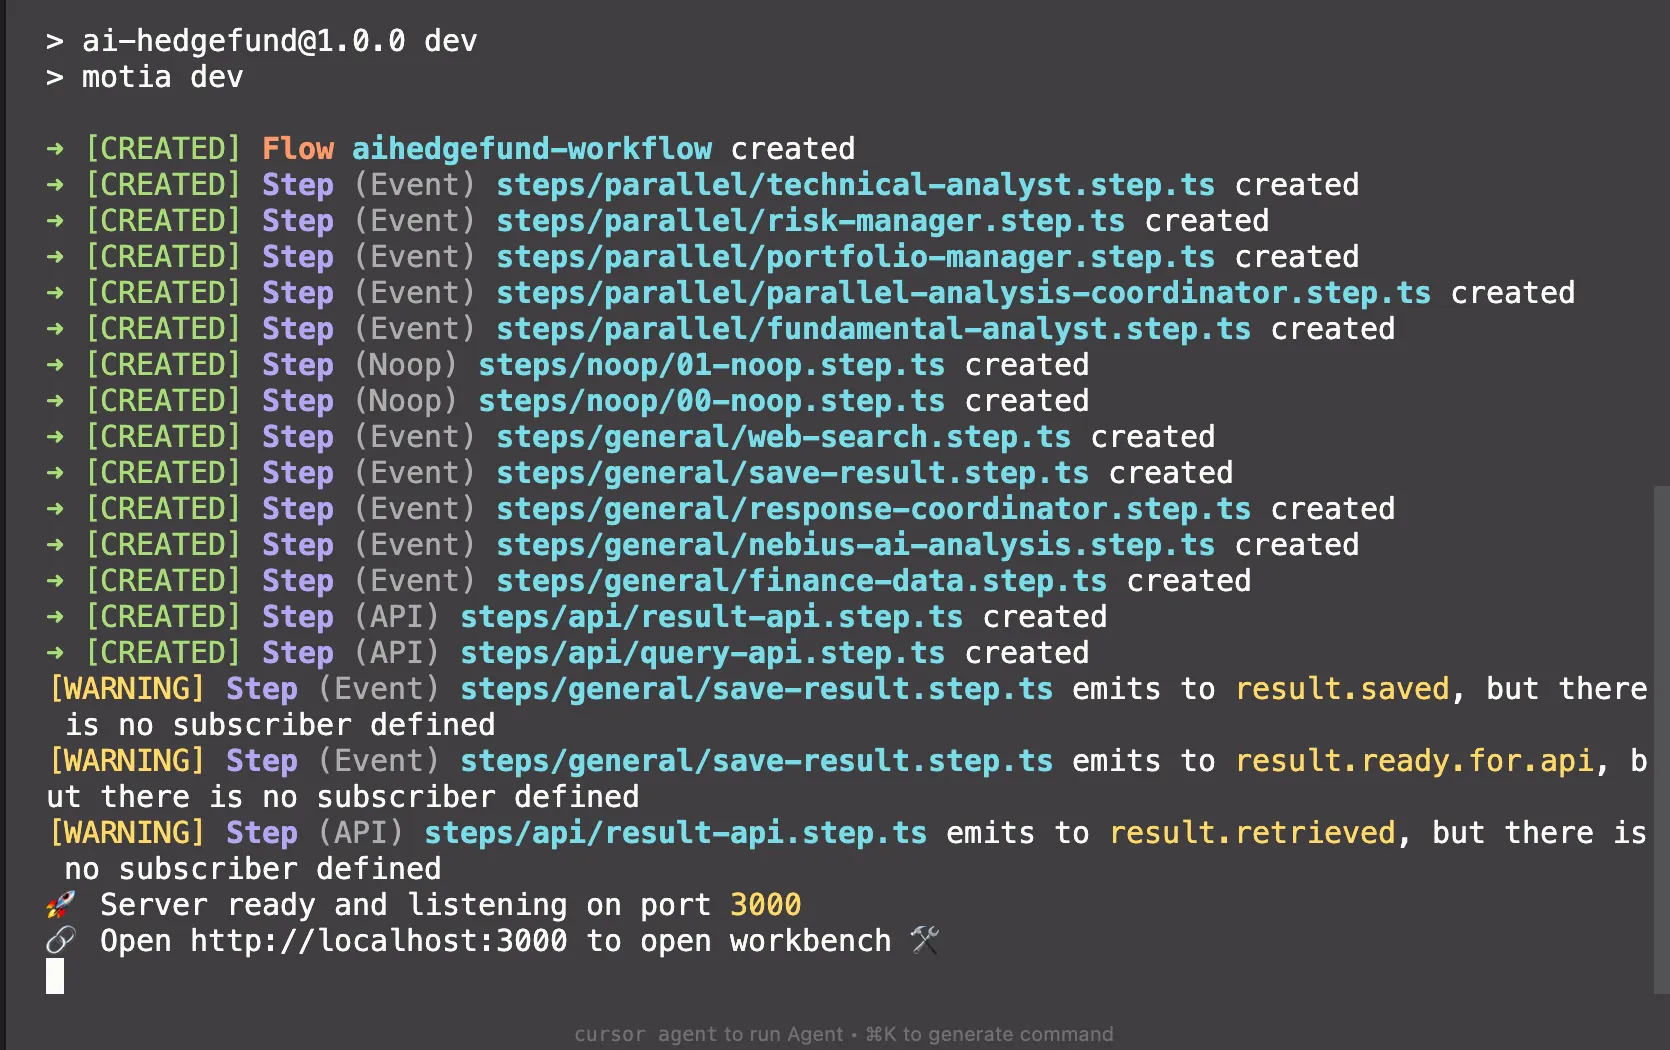
Start the Development Server
Run the Motia development server:
npm run dev
You should see:
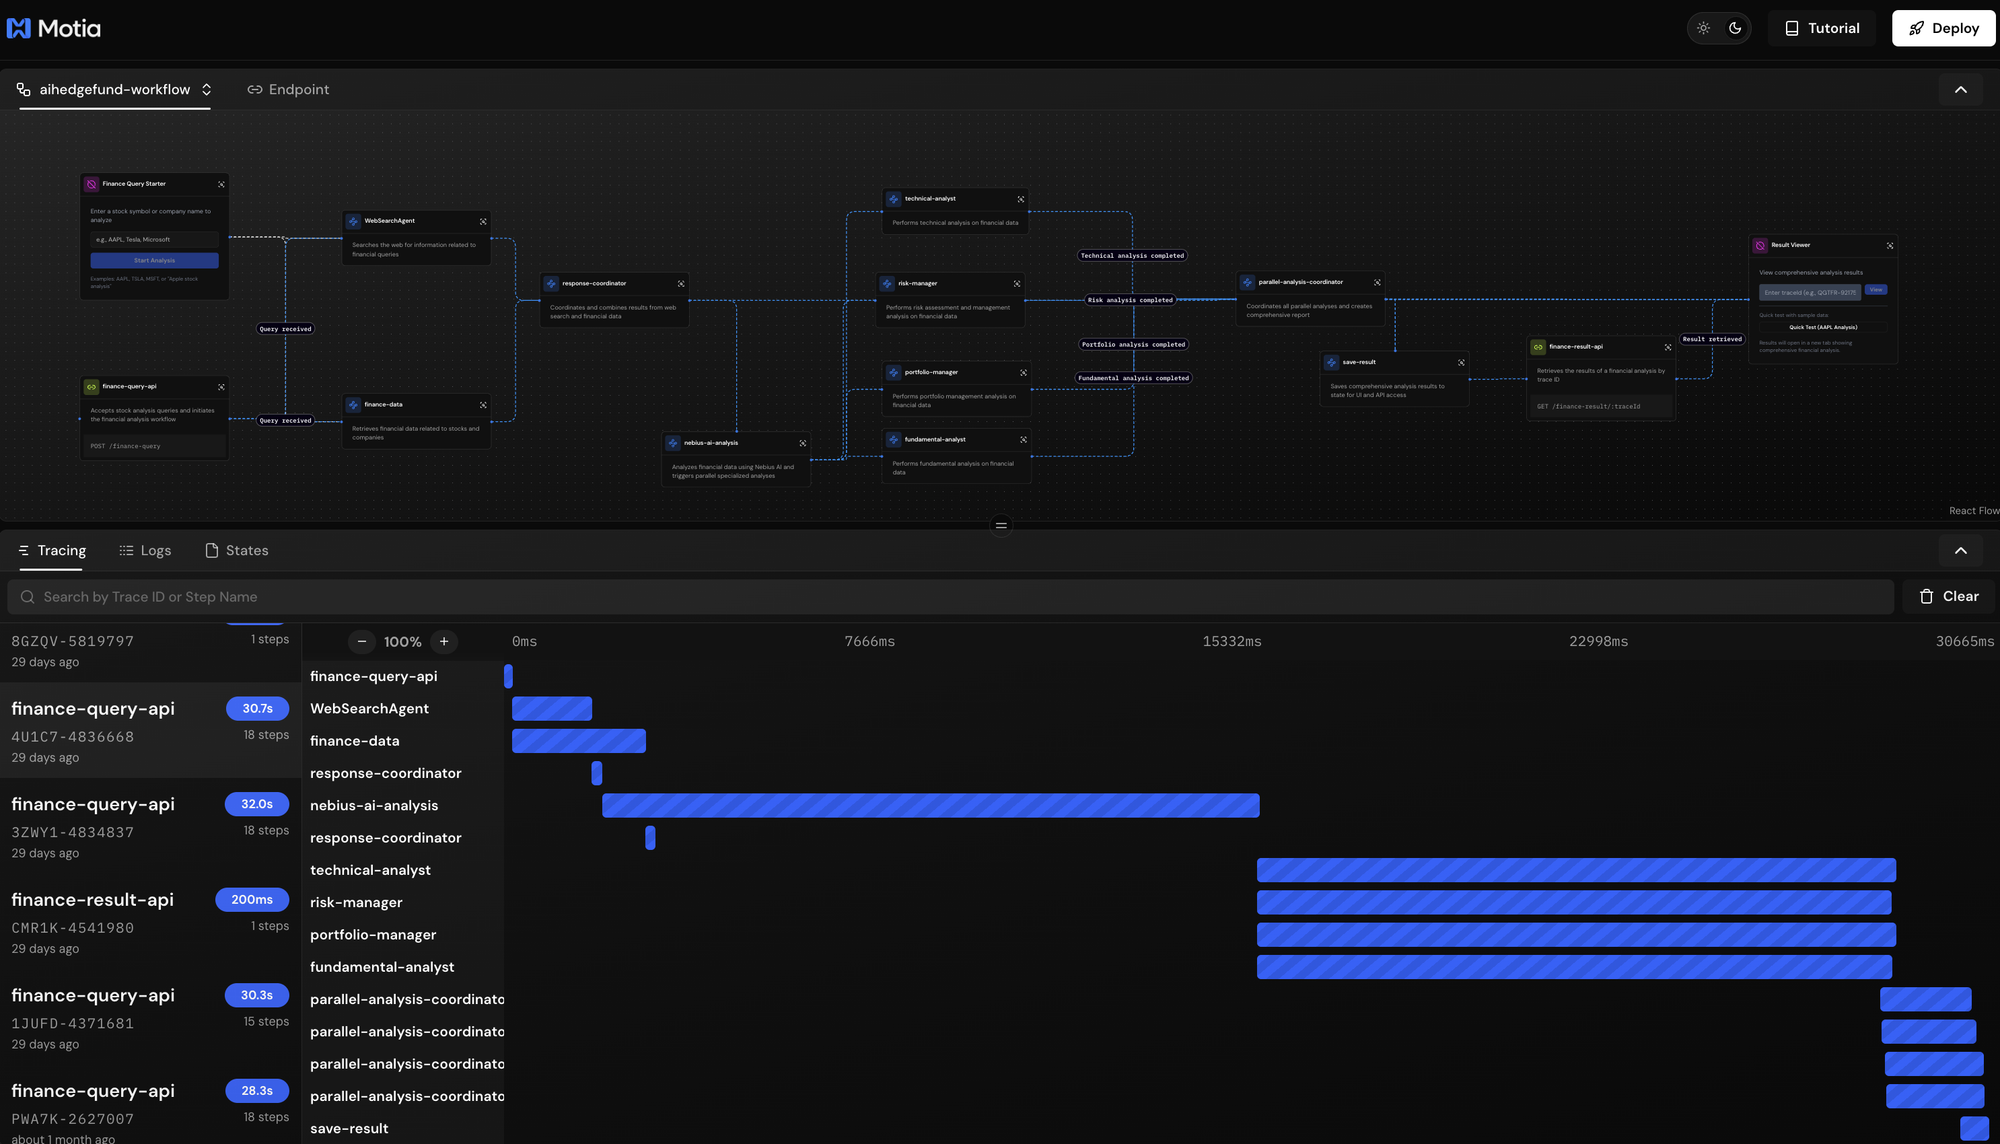
Explore the Workbench
Navigate to http://localhost:3000 in your browser. You'll see the Motia Workbench with:
- 11 connected workflow steps in the graph view
- Finance Query Starter (NOOP) component to trigger analyses
- Result Viewer (NOOP) component to view completed reports
The workflow is now ready. Let's understand how each step works together to deliver comprehensive financial analysis.
Understanding the Architecture
Before going into individual steps, let's understand how this workflow orchestrates hedge fund-quality analysis through event-driven coordination.
The system operates in three distinct phases:
- Phase 1: Parallel Data Collection - When a query is sent from the workbench, two agents gets into action simultaneously. The Web Search Agent scours the internet for latest news, market sentiment, and relevant articles while the Finance Data Service pulls real-time stock metrics from multiple sources (Alpha Vantage and Yahoo Finance with automatic fallback). This parallel approach cuts data gathering time in half.
- Phase 2: Coordinated AI Analysis - Once both data sources complete, a Response Coordinator intelligently merges web intelligence with financial metrics, creating a comprehensive context package. This package flows to a General AI Analysis step that provides initial market overview and, critically, triggers four specialized analysts to begin their work simultaneously. Each specialist: Fundamental, Portfolio, Risk, and Technical, receives the same comprehensive data but applies their unique analytical lens.
- Phase 3: Aggregation and Delivery - A Parallel Analysis Coordinator waits patiently for all five analyses to complete (the general analysis plus four specialists). Only when every analyst has reported does it synthesise their perspectives into a unified comprehensive report. Finally, the Save Result step stores this report in multiple formats for both API retrieval and UI display, ensuring instant access from any interface.
- Event-Driven Coordination - Steps don't call each other directly. Instead, they communicate through events. When the Web Search completes, it emits
web.search.completed. When Finance Data finishes, it emitsfinance.data.completed. The Response Coordinator subscribes to both events and only proceeds when it has received both. This loose coupling means steps can be modified, replaced, or scaled independently without breaking the workflow.
If the Fundamental Analyst encounters an API error, it emits a completion event with analysis: null. The system continues. The Parallel Coordinator still waits for all analysts but creates a report with whatever analyses succeeded. This resilience ensures users always get results, even if some components fail.
Step 1: API Entry Point
What This Step Does
The API Entry Point serves as the gateway to your financial analysis workflow. When a user submits a stock query like AAPL or Tesla analysis, this step validates the input, generates a unique trace ID for tracking, and emits an event that triggers the entire analysis pipeline. Think of it as the reception desk of your hedge fund, it takes client requests and dispatches them to the research team.
Key Code Sections
Step Configuration:
export const config: ApiRouteConfig = {
  type: 'api',
  name: 'finance-query-api',
  path: '/finance-query',
  method: 'POST',
  virtualSubscribes: ['flow.started'],
  emits: [{ topic: 'query.received', label: 'Query received' }],
  bodySchema: z.object({
    query: z.string().min(1, "Query must not be empty")
  }).strict(),
  flows: ['aihedgefund-workflow']
};
Why this matters: The configuration tells Motia this is an HTTP endpoint accessible at POST /finance-query. The bodySchema uses Zod to validate that incoming requests contain a non-empty query string, rejecting invalid requests before they enter the workflow. The emits declaration makes it clear this step will publish a query.received event that downstream steps can subscribe to.
Request Handler:
export const handler: Handlers['finance-query-api'] = async (req, { logger, emit, traceId }) => {
  try {
    await emit({
      topic: 'query.received',
      data: { query: req.body.query }
    });

    logger.info('Query received; analysis workflow initiated');

    return {
      status: 200,
      body: {
        query: req.body.query,
        message: 'Analysis workflow initiated successfully',
        traceId,
      }
    };
  } catch (error) {
    logger.error('Error processing query', { error });
    return {
      status: 500,
      body: { error: 'Failed to process query' }
    };
  }
};
Why this pattern: The handler extracts the query from the request body, emits the query.received event with the query data, and immediately returns a success response with the traceId. Notice it doesn't wait for the analysis to complete, this is crucial because financial analysis takes 30+ seconds. The API returns instantly, allowing the workflow to process asynchronously while the user can track progress using the returned traceId.
The traceId is critical: it's automatically generated by Motia for every request and serves as the unique identifier for this specific workflow execution. All subsequent steps will use this traceId to store and retrieve data in isolated state scopes, ensuring multiple users can run analyses simultaneously without data collision.
Event Connection to Next Steps
Step 1: API Entry Point
    │
    │ emits "query.received"
    │ data: { query: "AAPL" }
    ▼
Step 2: Web Search Agent
    subscribes to "query.received"

Step 3: Finance Data Service
    subscribes to "query.received"
Both the Web Search Agent (Step 2) and Finance Data Service (Step 3) subscribe to the same query.received event. When Step 1 emits this event, Motia automatically triggers both steps in parallel, they don't know about each other and don't need to coordinate. This loose coupling is the power of event-driven architecture: you can add more listeners to query.received (like a sentiment analysis agent) without modifying Step 1.
In the Motia Workbench, you'll see the query.received event appear in the Logs tab, and both Web Search and Finance Data steps will show activity as they process the query in parallel.
Step 2: Web Search Agent
What This Step Does
The Web Search Agent scours the internet for relevant financial information, news articles, market sentiment, and analyst opinions related to your query. Using the Serper API (a Google Search wrapper), it retrieves the latest web content that provides context beyond raw numbers—the stories, trends, and events that move markets. This intelligence gets combined with financial data to give AI analysts comprehensive context for their analysis.
Key Code Sections
Step Configuration:
export const config: EventConfig = {
  type: 'event',
  name: 'WebSearchAgent',
  subscribes: ['query.received'],
  emits: ['web.search.completed'],
  input: z.object({
    query: z.string()
  }),
  flows: ['aihedgefund-workflow']
};
Why this matters: This is an event-driven step (not an API endpoint). It subscribes to query.received from Step 1, meaning it automatically runs when the API emits that event. The step validates incoming data, ensuring it receives a valid query string.
Web Search Execution:
export const handler: Handlers['WebSearchAgent'] = async (input, { logger, emit, state, traceId }) => {
  try {
    const stateService = ServiceFactory.createStateService(state, traceId);

    *// Store original query for later steps*
    await stateService.set('original.query', input.query);

    *// Execute web search*
    const webSearchService = ServiceFactory.getWebSearchService();
    const searchResponse = await webSearchService.search(input.query);

    *// Store results in state*
    await stateService.set('web.search.results', searchResponse);

    *// Emit completion event with summary*
    const completionData: WebSearchCompletionData = {
      query: input.query,
      resultCount: searchResponse.results.length,
      resultSummary: searchResponse.results.map(result => result.title).join(', '),
      results: searchResponse.results
    };

    await emit({
      topic: 'web.search.completed',
      data: completionData
    });
  } catch (error) {
    logger.error('Web search failed', { error });
    *// Emit completion with empty results to prevent workflow blocking*
    await emit({
      topic: 'web.search.completed',
      data: { query: input.query, resultCount: 0, results: [] }
    });
  }
};
Why this pattern: The handler uses ServiceFactory to get a singleton instance of WebSearchService, avoiding repeated initialisation. It stores both the original query and search results in state using the traceId as scope, this ensures data isolation between concurrent workflow runs. Notice the error handling: if search fails, it still emits web.search.completed with empty results rather than crashing. This graceful degradation allows the workflow to continue with just financial data if web search is unavailable.
State Management Strategy:
const stateService = ServiceFactory.createStateService(state, traceId);
await stateService.set('original.query', input.query);
await stateService.set('web.search.results', searchResponse);
Why state storage: The original.query is stored because later steps (like the final report) need to reference what the user asked for. The web.search.results are stored so the Response Coordinator (Step 4) can retrieve them when combining with financial data. State scoping by traceId means User A's AAPL search and User B's TSLA search maintain separate data stores.
Event Connection to Next Steps
Step 1: API Entry Point
    │
    │ emits "query.received"
    ▼
Step 2: Web Search Agent ◄─── YOU ARE HERE
    │
    │ emits "web.search.completed"
    │ data: { query, resultCount, results }
    ▼
Step 4: Response Coordinator
    subscribes to "web.search.completed"
    (waits for both web search AND finance data)
The Web Search Agent runs in parallel with Finance Data Service (Step 3). Both subscribe to query.received but operate independently. The Response Coordinator (Step 4) subscribes to both web.search.completed and finance.data.completed, only proceeding when it has received both events, acting as a synchronisation point for the parallel data collection phase.
How the Search Works
The WebSearchService:
*// From services/utils/WebSearchService.ts*
public async search(query: string): Promise<SearchResponse> {
  const response = await axios.post('<https://google.serper.dev/search>', {
    q: query,
    gl: 'us',
    hl: 'en',
    num: 10
  }, {
    headers: { 'X-API-KEY': this.apiKey }
  });

  return {
    results: this.parseSerperResults(response.data),
    success: true
  };
}
Why Serper: It provides Google Search results via API without dealing with scraping or Google's official Search API complexity. The service parses organic results, "People Also Ask" sections, and knowledge graph data into a unified format that AI analysts can consume.
The step fetches ~10 search results containing latest Apple stock news, analyst opinions, and market commentary, providing rich context for AI analysis.
Step 3: Finance Data Service
What This Step Does
Extracts stock symbols from the query and fetches real-time financial data from Alpha Vantage and Yahoo Finance. Retrieves stock prices, market cap, P/E ratios, analyst ratings, company info, and recent news.
Key Code Sections
Step Configuration:
export const config: EventConfig = {
  type: 'event',
  name: 'finance-data',
  subscribes: ['query.received'],
  emits: ['finance.data.completed'],
  input: z.object({
    query: z.string().trim().min(1)
  })
};
Symbol Extraction and Data Fetching:
export const handler: Handlers['finance-data'] = async (input, { emit, logger, state, traceId }) => {
  const financeDataService = ServiceFactory.getFinanceDataService();
  const stateService = ServiceFactory.createStateService(state, traceId);

  *// Extract symbols like "AAPL", "TSLA" from query*
  const symbols = await financeDataService.extractPotentialSymbols(input.query);

  if (symbols.length === 0) {
    await emit({
      topic: 'finance.data.completed',
      data: { query: input.query, symbols: [], resultCount: 0 }
    });
    return;
  }

  *// Fetch data for each symbol with fallback handling*
  const results = await Promise.allSettled(
    symbols.map(symbol => financeDataService.getFinancialData(symbol))
  );

  const financialData = results
    .filter(result => result.status === 'fulfilled')
    .map(result => result.value);

  await stateService.set('finance.data', financialData);

  await emit({
    topic: 'finance.data.completed',
    data: {
      query: input.query,
      symbols,
      resultCount: financialData.length,
      resultSummary: `Retrieved data for ${symbols.join(', ')}`
    }
  });
};
Why this works: Uses Promise.allSettled so if one symbol fails (e.g., invalid ticker), others still complete. The FinanceDataService tries Alpha Vantage first, falls back to Yahoo Finance if that fails, ensuring data retrieval even if one API is down.
Event Connection
Step 1: API Entry Point
    │
    │ emits "query.received"
    ▼
Step 3: Finance Data ◄─── YOU ARE HERE (runs parallel with Step 2)
    │
    │ emits "finance.data.completed"
    ▼
Step 4: Response Coordinator
    (waits for both web + finance)
Step 4: Response Coordinator
What This Step Does
Waits for both web search AND finance data to complete, then merges them into a unified data package. Acts as the synchronisation point between parallel data collection.
Key Code Sections
Step Configuration:
export const config: EventConfig = {
  type: 'event',
  name: 'response-coordinator',
  subscribes: ['web.search.completed', 'finance.data.completed'],
  emits: ['response.completed']
};
Coordination Logic:
export const handler: Handlers['response-coordinator'] = async (input, { logger, emit, state, traceId }) => {
  *// Retrieve both data sources from state*
  const webSearchResults = await state.get(traceId, 'web.search.results');
  const financeData = await state.get(traceId, 'finance.data');

  *// Check if already coordinated (prevents duplicate processing)*
  const coordinationCompleted = await state.get(traceId, 'response.coordination.completed');
  if (coordinationCompleted) {
    logger.info('Response coordination already completed, skipping');
    return;
  }

  *// Only proceed if we have both data sources*
  if (!webSearchResults && !financeData) {
    logger.warn('Neither web search nor finance data available');
    return;
  }

  *// Format combined response*
  const formattedResponse = formatCombinedResponse(
    input.query,
    webSearchResults,
    financeData
  );

  const responseData = {
    query: input.query,
    timestamp: new Date().toISOString(),
    response: formattedResponse
  };

  *// Mark as completed to prevent duplicate processing*
  await state.set(traceId, 'response.data', responseData);
  await state.set(traceId, 'response.coordination.completed', true);

  await emit({
    topic: 'response.completed',
    data: responseData
  });
};
Why this pattern: This step is triggered by BOTH web.search.completed AND finance.data.completed events. Since both Steps 2 and 3 run in parallel, this coordinator might be called twice (once for each completion). The coordination.completed flag prevents duplicate processing. It only emits once after both data sources are available and merged.
Event Connection
Step 2: Web Search ──┐
                     ├──► Step 4: Response Coordinator ◄─── YOU ARE HERE
Step 3: Finance Data ─┘
                         │
                         │ emits "response.completed"
                         ▼
                    Step 5: General AI Analysis
Step 5: General AI Analysis
What This Step Does
Performs initial AI analysis on the combined data using Nebius AI, then triggers four specialized analysts to run in parallel. Acts as both an analyst and a dispatcher.
Key Code Sections
Step Configuration:
export const config: EventConfig = {
  type: 'event',
  name: 'nebius-ai-analysis',
  subscribes: ['response.completed'],
  emits: ['parallel.analyses.started']
};
Analysis and Parallel Trigger:
export const handler: Handlers['nebius-ai-analysis'] = async (input, { logger, emit, state, traceId }) => {
  const stateService = ServiceFactory.createStateService(state, traceId);

  *// Prepare analysis input from combined data*
  const analysisInput: AnalysisInput = {
    query: input.query || 'Unknown query',
    webResources: input.response?.webResources || [],
    financialData: input.response?.financialData || []
  };

  *// Perform general analysis*
  const nebiusService = ServiceFactory.getNebiusAIService();
  const generalAnalysis = await nebiusService.performAnalysis(analysisInput);

  *// Store general analysis*
  await stateService.set('ai.analysis', generalAnalysis);

  *// Trigger parallel specialized analyses*
  await emit({
    topic: 'parallel.analyses.started',
    data: {
      query: input.query,
      timestamp: input.timestamp,
      response: input.response,
      analysisInput,
      generalAnalysis,
      traceId
    }
  });
};
Why this structure: This step does double duty, it performs its own general market analysis AND emits an event that triggers four specialists simultaneously. The analysisInput package contains all the data specialists need, so they receive identical context but apply different analytical lenses.
Event Connection
Step 4: Response Coordinator
    │
    │ emits "response.completed"
    ▼
Step 5: General AI Analysis ◄─── YOU ARE HERE
    │
    │ emits "parallel.analyses.started"
    │
    ├──► Step 6: Fundamental Analyst
    ├──► Step 7: Portfolio Manager
    ├──► Step 8: Risk Manager
    └──► Step 9: Technical Analyst

    (All 4 run in parallel)
Step 6: Fundamental Analyst
What This Step Does
Performs fundamental analysis focusing on company valuation, financial health, competitive position, and long-term growth prospects using Nebius AI.
Key Code Sections
Step Configuration:
export const config: EventConfig = {
  type: 'event',
  name: 'fundamental-analyst',
  subscribes: ['parallel.analyses.started'],
  emits: [{ topic: 'fundamental.analysis.completed' }]
};
Fundamental Analysis:
export const handler: Handlers['fundamental-analyst'] = async (input, { logger, emit, state, traceId }) => {
  const stateService = ServiceFactory.createStateService(state, traceId);

  if (!input.analysisInput) {
    await emit({
      topic: 'fundamental.analysis.completed',
      data: { analysis: null, error: 'No analysis input available' }
    });
    return;
  }

  const nebiusService = ServiceFactory.getNebiusAIService();
  const fundamentalAnalysis = await nebiusService.performFundamentalAnalysis(
    input.analysisInput
  );

  await stateService.set('fundamental.analysis', fundamentalAnalysis);

  await emit({
    topic: 'fundamental.analysis.completed',
    data: {
      query: input.query,
      timestamp: input.timestamp,
      analysis: { ...fundamentalAnalysis, type: 'fundamental' }
    }
  });
};
Why specialized: The performFundamentalAnalysis method uses a different system prompt tailored for valuation analysis, financial ratios, and intrinsic value assessment. Each specialist (Steps 6-9) follows this same pattern but with domain-specific prompts.
Event Connection
Step 5: General AI Analysis
    │
    │ emits "parallel.analyses.started"
    ▼
Step 6: Fundamental Analyst ◄─── YOU ARE HERE (parallel with 7-9)
    │
    │ emits "fundamental.analysis.completed"
    ▼
Step 10: Parallel Coordinator
    (waits for ALL analysts)
Step 7: Portfolio Manager
What This Step Does
Performs portfolio management analysis focusing on asset allocation, diversification strategies, and portfolio optimization. Runs in parallel with the other three specialist analysts.
Key Code Sections
Step Configuration:
export const config: EventConfig = {
  type: 'event',
  name: 'portfolio-manager',
  subscribes: ['parallel.analyses.started'],
  emits: ['portfolio.analysis.completed'],
  input: z.object({
    query: z.string().optional(),
    timestamp: z.string(),
    response: z.any(),
    analysisInput: z.any().optional(),
    generalAnalysis: z.any().optional(),
    traceId: z.string().optional()
  })
};
Portfolio Analysis:
export const handler: Handlers['portfolio-manager'] = async (input, { logger, emit, state, traceId }) => {
  const stateService = ServiceFactory.createStateService(state, traceId);

  if (!analysisInput) {
    await emit({
      topic: 'portfolio.analysis.completed',
      data: { query: input.query, timestamp: input.timestamp, analysis: null }
    });
    return;
  }

  const nebiusService = ServiceFactory.getNebiusAIService();
  const portfolioAnalysis = await nebiusService.performPortfolioAnalysis(analysisInput);

  await stateService.set('portfolio.analysis', portfolioAnalysis);

  await emit({
    topic: 'portfolio.analysis.completed',
    data: {
      query: input.query,
      timestamp: input.timestamp,
      analysis: { ...portfolioAnalysis, type: 'portfolio' }
    }
  });
};
Why this matters: The performPortfolioAnalysis method uses a specialized system prompt focused on asset allocation, diversification, and risk-adjusted returns. Each specialist (Steps 6-9) follows the same handler pattern but calls different analysis methods with domain-specific prompts.
Event Connection
Step 5: General AI Analysis
    │
    │ emits "parallel.analyses.started"
    ▼
Step 7: Portfolio Manager ◄─── YOU ARE HERE (parallel with 6, 8, 9)
    │
    │ emits "portfolio.analysis.completed"
    ▼
Step 10: Parallel Coordinator
    (waits for ALL analysts)
Step 8: Risk Manager
What This Step Does
Performs comprehensive risk assessment focusing on market risk, volatility analysis, downside protection, and risk mitigation strategies.
Key Code Sections
Step Configuration:
export const config: EventConfig = {
  type: 'event',
  name: 'risk-manager',
  subscribes: ['parallel.analyses.started'],
  emits: ['risk.analysis.completed'],
  input: z.object({
    query: z.string().optional(),
    timestamp: z.string().datetime(),
    response: z.any(),
    analysisInput: z.any().optional(),
    traceId: z.string().optional()
  })
};
Risk Analysis:
export const handler: Handlers['risk-manager'] = async (input, { logger, emit, state, traceId }) => {
  const stateService = ServiceFactory.createStateService(state, traceId);

  if (!analysisInput) {
    await emit({
      topic: 'risk.analysis.completed',
      data: {
        query: input.query,
        timestamp: input.timestamp,
        analysis: null,
        error: 'No analysis input available'
      }
    });
    return;
  }

  const nebiusService = ServiceFactory.getNebiusAIService();
  const riskAnalysis = await nebiusService.performRiskAnalysis(analysisInput);

  await stateService.set('risk.analysis', riskAnalysis);

  await emit({
    topic: 'risk.analysis.completed',
    data: {
      timestamp: input.timestamp,
      analysis: { ...riskAnalysis, type: 'risk' },
      traceId
    }
  });
};
Why specialized analysis: The risk analysis uses prompts focused on volatility, beta, stress scenarios, and hedging strategies—different analytical lens than fundamental or technical analysis but same execution pattern.
Event Connection
Step 5: General AI Analysis
    │
    │ emits "parallel.analyses.started"
    ▼
Step 8: Risk Manager ◄─── YOU ARE HERE (parallel with 6, 7, 9)
    │
    │ emits "risk.analysis.completed"
    ▼
Step 10: Parallel Coordinator
    (waits for ALL analysts)
Step 9: Technical Analyst
What This Step Does
Performs technical analysis focusing on chart patterns, technical indicators (RSI, MACD), support/resistance levels, and price trends.
Key Code Sections
Step Configuration:
export const config: EventConfig = {
  type: 'event',
  name: 'technical-analyst',
  subscribes: ['parallel.analyses.started'],
  emits: ['technical.analysis.completed'],
  input: z.object({
    query: z.string().optional(),
    timestamp: z.string(),
    response: z.any(),
    analysisInput: z.any().optional(),
    traceId: z.string().optional()
  })
};
Technical Analysis:
export const handler: Handlers['technical-analyst'] = async (input, { logger, emit, state, traceId }) => {
  const stateService = ServiceFactory.createStateService(state, traceId);

  if (!analysisInput) {
    await emit({
      topic: 'technical.analysis.completed',
      data: {
        query: input.query,
        timestamp: input.timestamp,
        analysis: null,
        error: 'No analysis input available'
      }
    });
    return;
  }

  const nebiusService = ServiceFactory.getNebiusAIService();
  const technicalAnalysis = await nebiusService.performTechnicalAnalysis(analysisInput);

  await stateService.set('technical.analysis', technicalAnalysis);

  await emit({
    topic: 'technical.analysis.completed',
    data: {
      query: input.query,
      timestamp: input.timestamp,
      analysis: { ...technicalAnalysis, type: 'technical' }
    }
  });
};
Why this completes the team: Technical analysis focuses on price action and timing, complementing the fundamental (valuation), portfolio (allocation), and risk (protection) perspectives. Together, these four specialists provide comprehensive market coverage.
Event Connection
Step 5: General AI Analysis
    │
    │ emits "parallel.analyses.started"
    ▼
Step 9: Technical Analyst ◄─── YOU ARE HERE (parallel with 6, 7, 8)
    │
    │ emits "technical.analysis.completed"
    ▼
Step 10: Parallel Coordinator
    (waits for ALL analysts)
Step 10: Parallel Coordinator
What This Step Does
Waits for all five analyses to complete (general + four specialists), then combines them into a comprehensive investment report with executive summary and metadata.
Key Code Sections
Step Configuration:
export const config: EventConfig = {
  type: 'event',
  name: 'parallel-analysis-coordinator',
  subscribes: [
    'general.analysis.completed',
    'fundamental.analysis.completed',
    'portfolio.analysis.completed',
    'risk.analysis.completed',
    'technical.analysis.completed'
  ],
  emits: ['comprehensive.analysis.completed']
};
Analysis Configuration:
const ANALYSIS_CONFIGS: AnalysisConfig[] = [
  { key: 'general', stateKey: 'ai.analysis', analysisKey: 'generalAnalysis', topic: 'general.analysis.completed' },
  { key: 'fundamental', stateKey: 'fundamental.analysis', analysisKey: 'fundamentalAnalysis', topic: 'fundamental.analysis.completed' },
  { key: 'portfolio', stateKey: 'portfolio.analysis', analysisKey: 'portfolioAnalysis', topic: 'portfolio.analysis.completed' },
  { key: 'risk', stateKey: 'risk.analysis', analysisKey: 'riskAnalysis', topic: 'risk.analysis.completed' },
  { key: 'technical', stateKey: 'technical.analysis', analysisKey: 'technicalAnalysis', topic: 'technical.analysis.completed' }
];
Coordination Logic:
export const handler: Handlers['parallel-analysis-coordinator'] = async (input, { logger, emit, state, traceId }) => {
  const stateService = ServiceFactory.createStateService(state, traceId);

  *// Gather all completed analyses*
  const analyses: Record<string, any> = {};
  const completedAnalyses: string[] = [];

  for (const config of ANALYSIS_CONFIGS) {
    const analysis = await stateService.get(config.stateKey);
    if (analysis) {
      analyses[config.analysisKey] = analysis;
      completedAnalyses.push(config.key);
    }
  }

  *// Check for duplicate processing*
  const coordinationCompleted = await stateService.get('coordination.completed');
  if (coordinationCompleted) {
    logger.info('Coordination already completed, skipping');
    return;
  }

  *// Wait for all analyses (5 total)*
  const expectedAnalyses = ANALYSIS_CONFIGS.map(config => config.key);
  if (completedAnalyses.length < expectedAnalyses.length) {
    return; *// Not ready yet, wait for more*
  }

  *// Create comprehensive report*
  const comprehensiveReport = createComprehensiveReport(analyses);

  *// Store results in multiple locations*
  await stateService.set('comprehensive.analysis', comprehensiveReport);
  await stateService.set('comprehensive.results', {
    query: originalQuery,
    timestamp: new Date().toISOString(),
    comprehensiveReport,
    ...analyses,
    status: 'completed'
  });

  await stateService.set('coordination.completed', true);

  await emit({
    topic: 'comprehensive.analysis.completed',
    data: { query: originalQuery, comprehensiveReport, status: 'success' }
  });
};
Why this pattern works: This step subscribes to FIVE different topics (one from general analysis, four from specialists). It's called multiple times as each analysis completes, but uses coordination.completed flag to prevent duplicate report generation. Only proceeds when all five analyses are present.
Event Connection
Step 6: Fundamental ──┐
Step 7: Portfolio ────┤
Step 8: Risk ─────────┼──► Step 10: Parallel Coordinator ◄─── YOU ARE HERE
Step 9: Technical ────┤
Step 5: General ──────┘
                        │
                        │ emits "comprehensive.analysis.completed"
                        ▼
                   Step 11: Save Result
Step 11: Save Result
What This Step Does
Saves the comprehensive analysis report to multiple state locations for different access patterns (UI, API, workflow status). Final step in the workflow.
Key Code Sections
Step Configuration:
export const config: EventConfig = {
  type: 'event',
  name: 'save-result',
  subscribes: ['comprehensive.analysis.completed'],
  emits: ['result.saved', 'result.ready.for.api'],
  input: z.object({
    query: z.string().optional(),
    comprehensiveReport: z.any().optional(),
    status: z.string().optional()
  })
};
Result Persistence:
export const handler: Handlers['save-result'] = async (input, { logger, state, traceId, emit }) => {
  const stateService = ServiceFactory.createStateService(state, traceId);

  *// Check for duplicate saves*
  const resultsSaved = await stateService.get('results.saved');
  if (resultsSaved) {
    logger.info('Results already saved, skipping');
    return;
  }

  *// Retrieve comprehensive results*
  const comprehensiveResults = await stateService.get('comprehensive.results');
  const comprehensiveAnalysis = await stateService.get('comprehensive.analysis');
  const queryResult = await stateService.get('query.result');

  if (!comprehensiveResults && !comprehensiveAnalysis && !queryResult) {
    logger.warn('No comprehensive analysis results found');
    return;
  }

  *// Prepare result data*
  const resultData = comprehensiveResults || {
    query: queryResult?.query || input?.query || 'Unknown query',
    timestamp: queryResult?.timestamp || new Date().toISOString(),
    comprehensiveReport: comprehensiveAnalysis || input?.comprehensiveReport,
    status: 'completed',
    completedAt: new Date().toISOString()
  };

  *// Store in multiple locations for different consumers*
  await stateService.set('ui.result', resultData);
  await stateService.set('api.result', resultData);
  await stateService.set('workflow.status', {
    status: 'completed',
    completedAt: new Date().toISOString()
  });

  await stateService.set('results.saved', true);

  logger.info('Comprehensive analysis results saved successfully');
};
Why multiple storage locations: The UI Result Viewer (NOOP component) reads from ui.result, the GET API endpoint reads from api.result, and workflow monitoring reads from workflow.status. This denormalization trades storage for read performance—each consumer gets data in its preferred format without joins.
Event Connection
Step 10: Parallel Coordinator
    │
    │ emits "comprehensive.analysis.completed"
    ▼
Step 11: Save Result ◄─── YOU ARE HERE (final step)
    │
    │ Results stored in state
    ▼
GET /finance-result/:traceId retrieves saved results
Conclusion
You've just built a production-ready AI hedge fund analysis system that delivers institutional-quality investment research in under 60 seconds. By combining Motia's event-driven architecture with Nebius AI's analytical capabilities, you've created a workflow that would typically require an entire research team, automated from a single API call.
What You Accomplished
Over the course of this tutorial, you created:
- A parallel data collection system that simultaneously gathers web intelligence and real-time financial metrics
- Five specialized AI analysts working in concert, each bringing domain expertise in fundamental analysis, portfolio management, risk assessment, and technical analysis
- Smart coordination logic that synchronises asynchronous processes and combines multiple perspectives into comprehensive reports
- Production-grade patterns including graceful degradation, state management, and multi-location data persistence
More importantly, you learned how Motia's event-driven model eliminates the complexity of traditional microservice architectures. No more manually orchestrating service-to-service calls, managing distributed state, or debugging cascading failures. Each step is a focused function that listens for events and emits new ones, the framework handles the rest.
Key Takeaways
Event-driven scales naturally - Adding the four parallel analysts required no changes to existing steps. Each analyst independently subscribes to the same event and runs simultaneously.
State management simplifies coordination - Instead of passing data through complex service meshes, steps read and write to scoped state storage, eliminating tight coupling.
Graceful degradation is built-in - The system continues working even when individual components fail. Missing a technical analysis? The comprehensive report includes the other four perspectives.
Next Steps
Ready to deploy your AI hedge fund analysis system? Check out the Motia deployment documentation to learn about production configurations, monitoring, and scaling options. The included Docker setup gets you to production quickly with proper health checks and auto-restart capabilities.
Motia Cloud Deployment
Want to try more Motia Examples? Explore the examples repository
Complete source code: